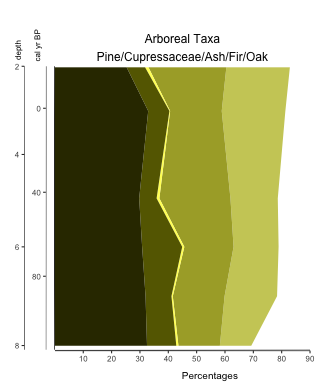
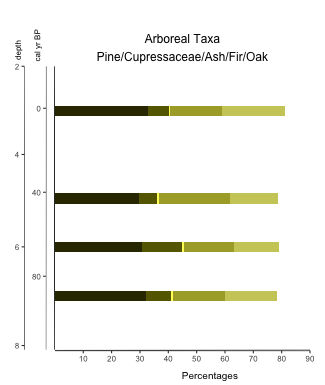
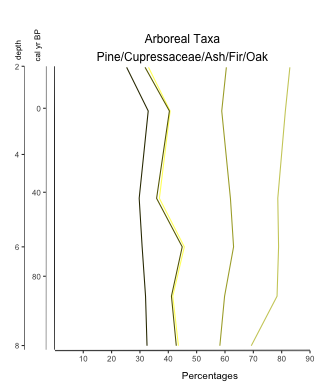
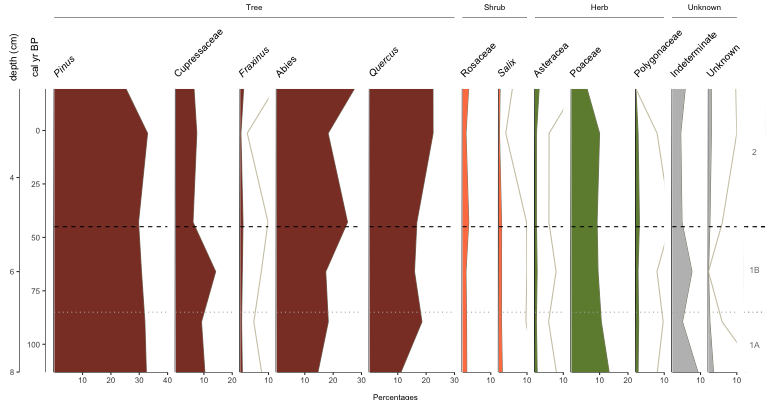
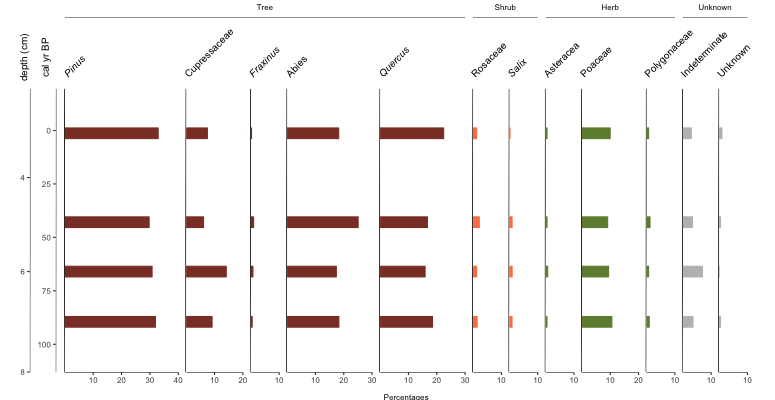
We’ve all been there… created a bunch of graphs that now we have to copy/paste together in image editing software. It just disrupts the workflow, you know? I like to make less work for myself. That’s not to say I don’t still need to tweak this in an image editor, but I can at least minimize how often I have to. Enter the ability to append (that means sticking together one after another) graphic into one diagram! The tutorial for how to do so is now available. Here’s a sneak peak of two stacked plots appended into one image (notice, y-axis appears only on the left and is not duplicated for each plot. I give you options like that… 😉 )
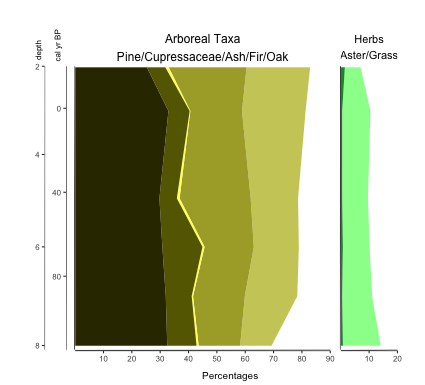
tutorial
Palyoplot Stacked Diagram Tutorial is Up
Basic Palyoplot Tutorial is Up
Seems I’m being extra productive today. Created a basic tutorial on creating diagrams using Palyoplot’s built-in datasets. It should be enough to get you started with the functionality and exploring how the datasets are setup in R.
To give you a little bit of a sneak peak before heading over there…
library(palyoplot) axis2 = palyoplot_get2ndAxis(interval=2, top=-20, bottom=115, ages=pp_agemodel) graph1 = palyoplot_plotTaxa(xdata=pp_xdata, ydata=pp_ydata, ylabel="cal yr BP", bottomLabel="Percentages", colors=pp_colors, y2=axis2, y2label="depth (cm)", fontstyles=pp_fontStyles, taxaGroups=pp_taxaGroups, plotStyle="line"))