What is Palyoplot?
<tl;dr> An R package that simplifies the visualization and creation of multi-axis stratigraphic plotting of Quaternary Science Data
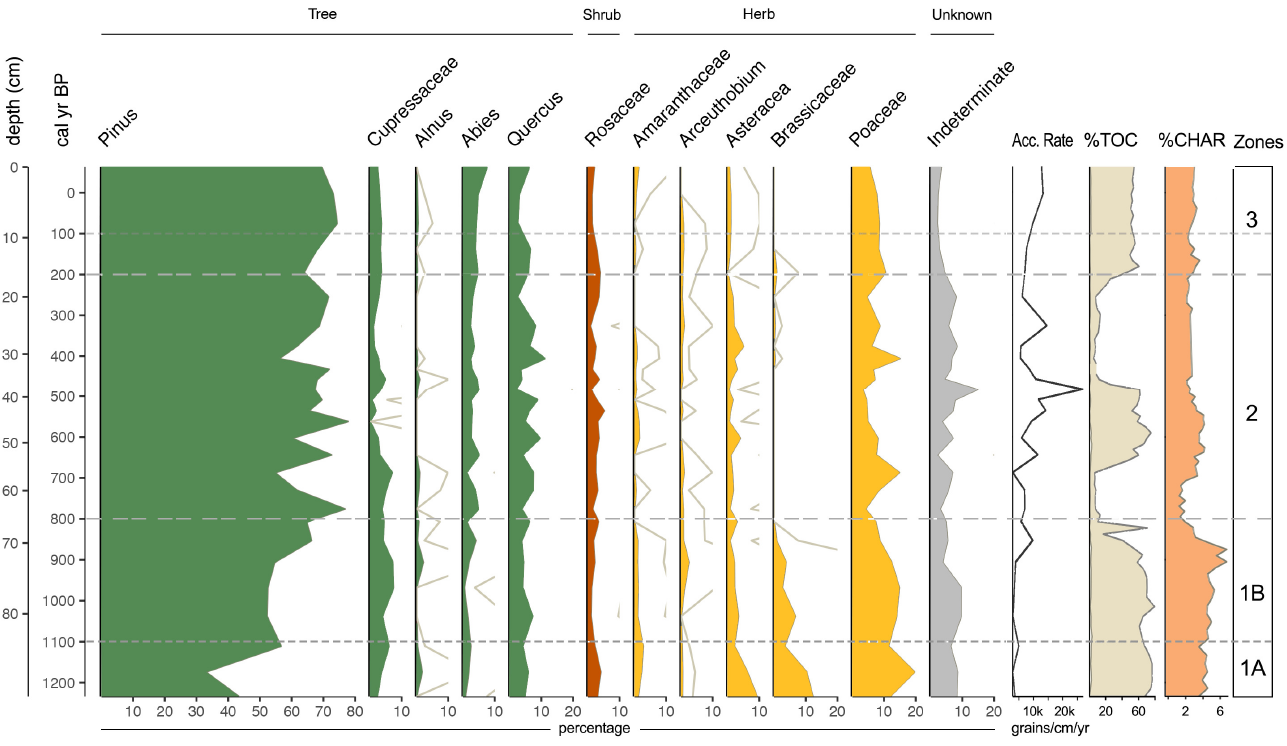
Long version: Palyoplot is an R package that adds publication-quality Quaternary science data visualization functions. Palyoplot implements customizable stratigraphical diagramming of proxy records such as pollen, sedimentary charcoal, and diatoms, and is appropriate for routine and scientific research use. It includes the ability to create standard stratigraphic plot by taxa, stacked taxa plots, and appending multiple plots to create one larger plot
Why use Palyoplot?
- create publication-quality stratigraphic plots, and in multiple formats (.jpg, .png, .pdf, etc)
- Customizable stratigraphic diagrams of proxy records (including point, line, bar, and stacked graphs)
- Reusable configuration files simplify processing and standardize your lab’s look-and-feel
- User-defined groups and ordered taxa
- Custom color application by group and/or taxa
- Multiple y-axes (ex: depth and age)
- Customizable y and x-axis intervals
- Exaggerated values (default 10x)
- Leverages ggPlot2, grid, gtable, scales, and data.table R packages
The Palyoplot Way
R code automates the process and does the heavy lifting for. Contrain your data based on your period of interest without having to edit files. Automtically extrapo- late and assign your age model to your data. Dynamically convert your counts to percentages, and exclude from drawing taxa that don’t meet a minimum threshold. Exclude entire groups from being drawn (sub-setting your data). Ensure consistency in the order your data displays.
No more constantly having to adjust set- tings in software dialog boxes to get the look-and-feel you want! Maintain consis- tency of design between various studies and publications. Quickly and easily alter graphics for print vs presentations (font sizes, typeface, b/w vs. color, etc).
Where can I get Palyoplot to see if it’s right for me?
Palyoplot is in beta testing & available for download at: http://geotechnography.com/samples/palyoplot. Sample data, configuration files, and documentation are included in the package. Sample data and configuration files are also available on the download page.
How do I install Palyoplot?
To install using R Studio, go to Tools > Install Packages > Install from: Package archive file, then select the downloaded file (ex: palyoplot_0.0.8.tar.gz)
What support is there for getting help with setting this thing up?
There are help files in R (ex: ?palyoplot), sample files on the download page, and a tutorial that doesn’t exist yet. It’s just me, but feel free to contact me for assistance. I’m sure you can figure out how (glances up at the Twitter (@eradani) and Facebook icons) 😉 (darned spammers)
What genius created this amazing package?
Aww… *blush* thanks for asking! I’m Anna, an Assistant Professor in the Geography Department at Sacramento State University (and the owner of this site). This package was born from frustration of dealing with software and workflow issues during my dissertation at the University of Nevada Reno (Go Wolfpack!), and wanting to simplify the process (it’s always the side projects that end up most useful, isn’t it?). I actually developed an entire workflow and database setup that synergizes with this package, if you’re interested.